Key takeaways
- Design each dashboard around three to five questions users actually ask.
- Lead with the number that matters, then show the trend and context.
- Fewer, well-labelled charts beat dense walls of widgets.
- Every metric should link to the place where someone can act on it.
Dashboards promise clarity but often deliver noise. A typical story: a team asks for "a dashboard", someone connects every available metric, and the result is a wall of charts that's opened enthusiastically for a week and then forgotten.
The difference between a dashboard that's opened every morning and one that's ignored comes down to a handful of design decisions. They apply whether you're building an operations view for a recruitment platform, a sales overview, an IoT monitoring screen or an admin panel.
Start with questions, not data
Before opening a design tool, interview the people who'll use it. Ask what they're trying to decide, how often, and what they do today to find out.
Write down the three to five questions the dashboard must answer. Good questions are specific:
- Are we on track for this month's target?
- What changed since yesterday, and why?
- Which candidates are stuck, and at which step?
- Which devices haven't reported in the last hour?
Every element on the dashboard should answer one of these questions. If a chart doesn't, it belongs somewhere else, perhaps in a detailed report that people open when they need it.
Know who it's for
Different people need different dashboards, even from the same data:
| Audience | Typical need | Design implications |
|---|---|---|
| Executives | Are we on track? | Few headline numbers, targets, trends |
| Managers | Where should my team focus? | Breakdowns, comparisons, exceptions |
| Operators | What needs action right now? | Lists, statuses, alerts, direct links to act |
| Analysts | Why did this happen? | Filters, drill-downs, exportable data |
Trying to serve all four on one screen is the most common reason dashboards become cluttered. Separate views, or a clear top-to-bottom progression from summary to detail, work far better.
Establish a clear hierarchy
Read a well-designed dashboard from top-left to bottom-right and the story unfolds:
- The headline number: large, at the top, with its target or comparison ("₹4.2L of ₹5L target, 84%").
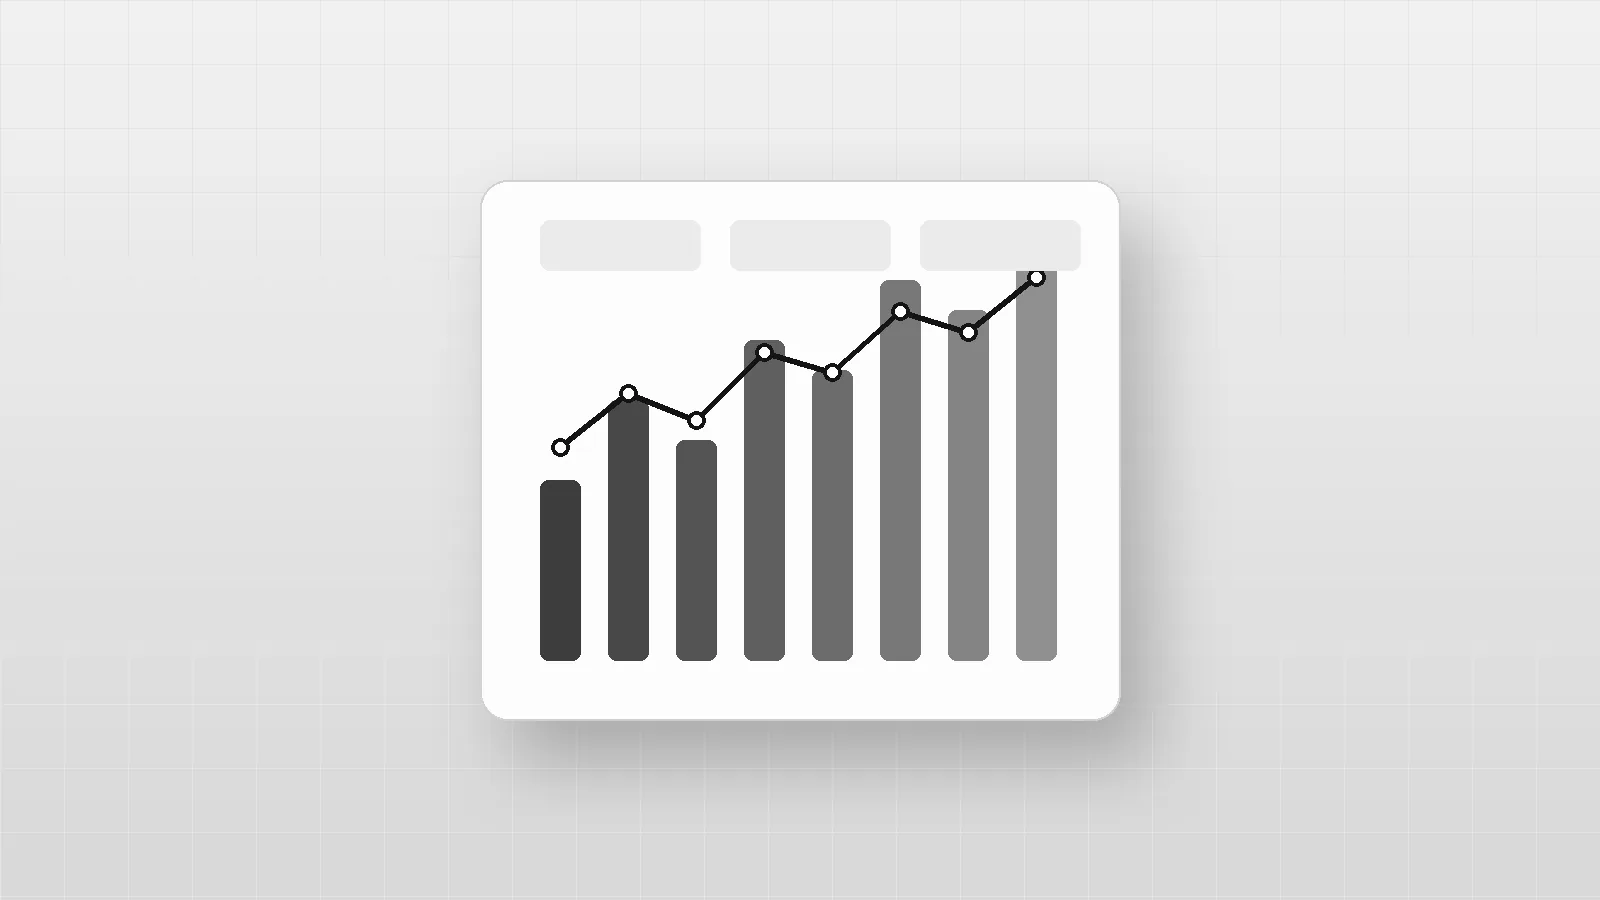
- The trend: is it going up or down, and how fast? A small line next to the number often says enough.
- The breakdown: which segments, teams, regions or products drive the change?
- The detail: a table or list for people who need exact values or want to act on individual items.
Size and position communicate importance. If everything is the same size, nothing is important.
Numbers need context
A number on its own invites the question "is that good?". Always pair key metrics with context:
- Comparison: versus last period, the same period last year, or a target.
- Direction: an arrow or sign showing whether higher is better.
- Time frame: "last 7 days" or "this month to date", stated clearly.
- Freshness: "Updated 10 minutes ago", so nobody makes decisions on stale data.
Be careful with percentage changes on small numbers. "Up 200%" sounds dramatic when it means two sign-ups became six.
Choose charts deliberately
| Question | Chart |
|---|---|
| How is it changing over time? | Line chart |
| How do categories compare? | Bar chart (horizontal for long labels) |
| What's the current value? | Single stat with comparison |
| How is a whole split into parts? | Stacked bar, or a simple table |
| How are two measures related? | Scatter plot |
| What are the exact figures? | Table |
| Where is a process getting stuck? | Funnel or step chart |
Some charts deserve caution:
- Pie and donut charts make comparisons hard once there are more than two or three slices.
- Gauges take a lot of space to show one number.
- 3D charts distort values and should be avoided.
- Dual-axis charts are easy to misread; use two small charts instead.
Reduce, then reduce again
Clutter hides insight. For every element, ask whether it carries information:
- remove heavy gridlines, borders and backgrounds
- label lines directly instead of relying on a legend
- round numbers to the precision people actually need
- use consistent scales across charts that will be compared
- start bar charts at zero, so bar length is honest
Use colour sparingly, only to highlight what matters. In a greyscale system like ours, weight, contrast and a single dark accent do the same job, and they force restraint.
Design for exceptions
Most of the time, most metrics are fine. Dashboards are most useful when they make the exceptions obvious:
- highlight values outside an expected range
- show a short "needs attention" list at the top: overdue tasks, offline devices, stalled pipeline stages
- use clear status labels in text ("Delayed", "Offline"), not just a coloured dot
For operational dashboards, consider whether some exceptions should become alerts instead. Nobody should have to watch a screen to catch a problem.
Design the empty, loading and error states
Real dashboards spend a surprising amount of time in states designers forget:
- Empty: a new account with no data yet should explain what will appear and how to get started.
- Loading: skeletons that match the final layout feel faster than spinners.
- Partial data: if one source is delayed, say so, rather than showing a misleading zero.
- Errors: explain what failed and what the user can do.
Make it actionable
A dashboard that only reports is half finished.
Link every metric to the place where someone can act on it:
- a stalled-candidates count opens the filtered list of those candidates
- an offline-devices number opens those devices with their last-known status
- a revenue dip drills down to the products or regions responsible
Filters should be few, obvious and remembered between visits. Allow exporting the underlying data, because someone will always want to dig deeper in a spreadsheet.
Make it responsive and accessible
People check dashboards on phones, on wall screens and in meetings:
- prioritise the headline numbers on small screens, and let charts stack
- keep touch targets large enough for fingers
- never use colour alone to encode meaning; add labels, patterns or icons
- check contrast for text, lines and data points
- provide data tables or text summaries for screen-reader users
- make interactive charts usable with a keyboard
Performance matters
A dashboard that takes ten seconds to load won't be opened every morning:
- pre-aggregate data instead of computing it on every page view
- load the headline numbers first, then the detail
- cache results and show when data was last refreshed
- paginate long tables
Measure whether it's working
Treat the dashboard as a product:
- how many people open it, and how often?
- which charts are interacted with, and which are ignored?
- do people still export data to answer the same questions elsewhere?
- ask users every few months: what question does this still not answer?
Remove charts nobody uses. Dashboards should get simpler over time, not more crowded.
A checklist before you ship
- Three to five clearly written questions, each answered on the page
- One headline number with context at the top
- Chart types matched to the questions
- Direct labels, honest scales and sensible rounding
- Exceptions highlighted with text, not colour alone
- Empty, loading, partial and error states designed
- Every key metric links to where someone can act
- Works on mobile and with a keyboard
- Data freshness shown
Planning a dashboard, admin panel or data-heavy product? See our web development and design and custom software work, or tell us what your team needs to see.
Frequently asked questions
How many charts should a dashboard have?
As few as needed to answer its core questions — often four to six. If users must scroll to find the key number, the dashboard is doing too much.
Which chart type should I use?
Lines for trends over time, bars for comparing categories, a single large number for a key metric, and tables when people need exact values.
Should a dashboard update in real time?
Only if decisions are made in real time, as in operations or incident response. For most business dashboards, hourly or daily data is enough, and showing when it was last updated matters more than live refresh.
How do you make dashboards accessible?
Never rely on colour alone, label data directly, ensure text and lines meet contrast requirements, support keyboard navigation for interactive charts, and provide the underlying numbers as a table for screen-reader users.
Written by
Engineering & Design
Notes from the designers and engineers building products at BreaktroughF1: what we learned, what we'd do again and what we'd do differently.